Analyzing Charts
Analyzing charts seems tricky in the beginning, and having to remember several things all at once while your stock price plummets, is easier said than done, but just like learning how to drive a manual car, it gets easier over time, and becomes automatic eventually.
Fundamentals
I will be using Apple for my examples, since it is well known.
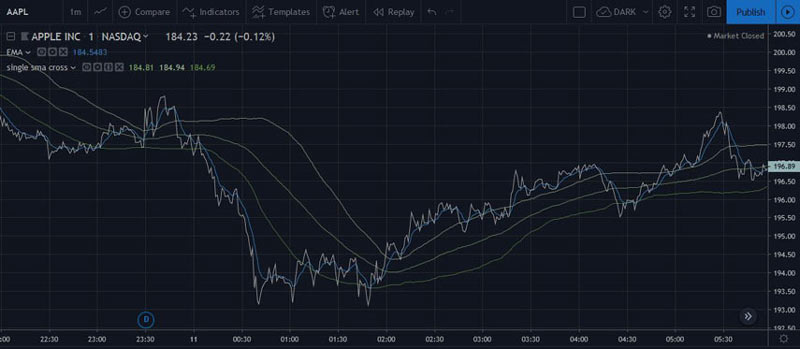
Ok, first off is the blue D, or dividends, which may drive the price up if it is above expectations and drive it down if not. There is also Ema, and Sma lines, which are more advanced, but are just general guides to aid in entry/exit points.
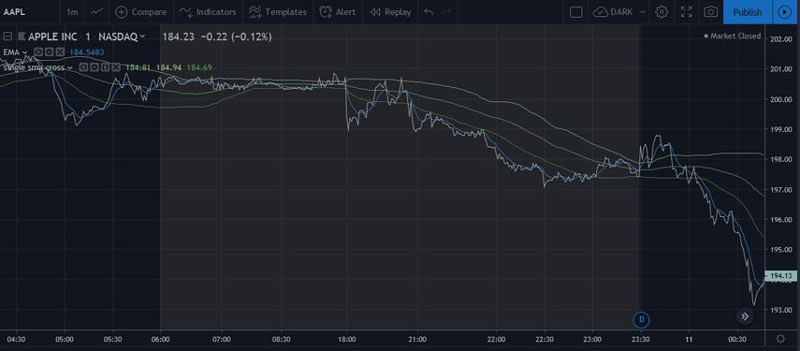
There is also pretrading data, (available on some charts) which can be a real asset in determining whether the stock is going up or down.
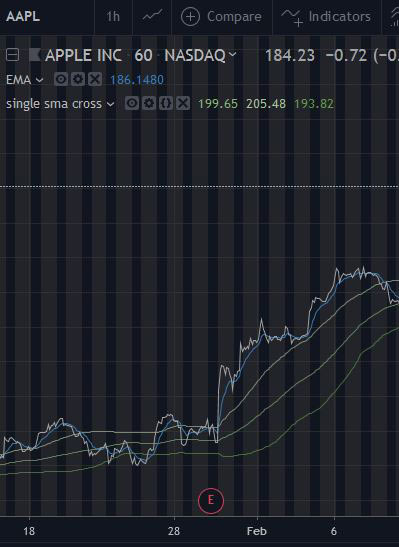
Earnings reports, (red E) can also affect stock prices. But not always.