Advanced Chart Analysis.
Ok, eventhough a newbie doesn't really need to know these additional aids initially, they do come in handy later on, here are the ones l would recommend. And there are plenty more, but l don't believe that they are necessary.
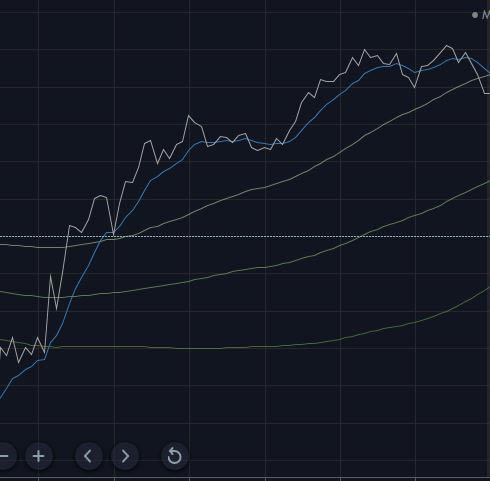
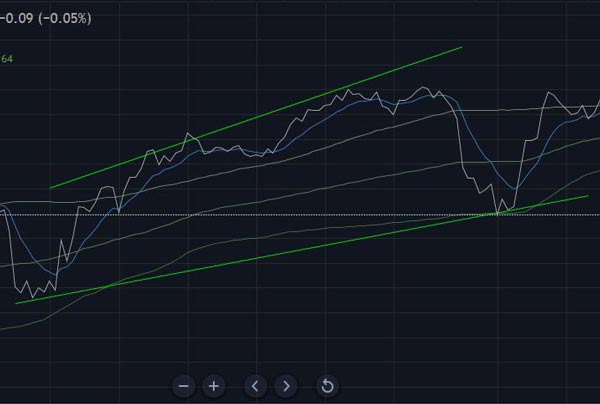
This shows SMA and EMA lines.
Ema, (Exponential Moving Average, blue line) that places a greater weight and significance on the most recent data points, moving average reacts more significantly to recent price changes, hence it is closer to the current price.
Sma is broader, (simple moving average, green lines) and is an arithmetic moving average calculated by adding recent closing prices and then dividing that by the number of time periods in the calculation average. I know complex, but they are just guides to when to enter or exit a trade.